Mastering RSI Indicator in Stock Market Best Settings and Strategies 2025
Every trader always dreams of knowing when to buy and when to sell, but very few people truly understand the underlying scenario of the market and how it moves. The RSI indicator is one of the most powerful indicators because it helps us determine when the market is up and when it is down, i.e., it guides us to the overbought and oversold zones. You’ll learn how RSI works, how to Mastering RSI Indicator in Stock Market Best Settings and Strategies (2025)
What Is the RSI Indicator? Complete Guide

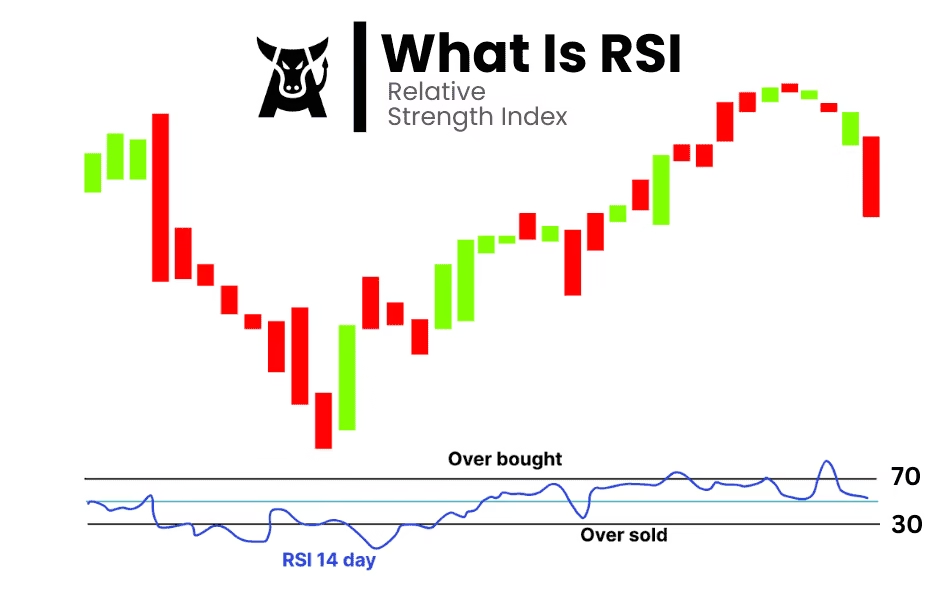
This is my favorite and simplest indicator; I have been trading based on this indicator for the last four years. RSI always focuses on three things, like overbought or oversold. And how much is the strength or speed in the market? RSI (Relative Strength Index) was developed by J. Welles Wilder in 1978. It measures the speed and change of price movements and tells whether the asset is overbought or oversold.
What is the RSI Indicator Formula?
If you want to understand the RSI formula, then look at this carefully.
- The RSI formula: RSI 100 – [100 ÷ (1 + RS)]
- The meaning of RS is the ratio of average gain to average loss.
- Definitions of Average Gain and Average Loss based on the last 14 days.
- Clarification that the RSI value ranges between 0 and 100.
Practical Example of the RSI formula
Suppose you want to calculate RSI for any stock over 14 days.
- The stock had 9 up days with an average gain of 2.3%
- The stock had 5 down days with an average loss of 1.4%
calculation:
- Average gain = 2.3% × (9/14) = 2.3 × 0.642857 = 1.4786% (Average Gain = 1.48%)
- Average loss = 1.4% × (5/14) = 1.4 × 0.357143 = 0.5% (Average Loss = 0.50% )
- RS = 1.48% ÷ 0.5% = 2.96
- RSI = 100 – (100 / (1 + 2.96)) = 100 – 25.25 = 74.75
This RSI value of 74.75 indicates the stock is in the overbought zone since the RSI is above 70, indicating that the price has risen significantly, and a potential reversal or pullback may occur soon.
Final Answers:
| Step | Formula | Result |
|---|---|---|
| Average Gain | 2.3% × (9/14) | 1.48% |
| Average Loss | 1.4% × (5/14) | 0.50% |
| RS | 1.48 ÷ 0.50 | 2.96 |
| RSI | 100 – (100 / (1 + 2.96)) | 74.75 (Overbought Zone) |
RSI Indicator Buy and Sell Signals
First, I explained what RSI is, how it works, and what its formula is. Now, we will focus on how we can buy and sell using RSI. Basically, People trade by using different settings of RSI, but I will tell you about the default setting of RSI only. According to my experience, RSI always identifies a zone where you have to be ready to buy and sell.
| RSI Value | Market Condition | Trading Signal |
|---|---|---|
| 70 and above | Overbought | Possible Sell Signal |
| 30 and below | Oversold | Possible Buy Signal |
| Around 50 | Sideways | Wait and watch |
| Read More – Best 2 EMA Crossover Strategy for Consistent Profits
RSI Indicator Settings
A major advantage of RSI settings is that you should set your RSI according to your trading style and always combine it with price action or any other indicator, and take your trade as soon as you get confirmation.
Best RSI settings for 5-minute chart
- RSI Period: 10
- Overbought Level: 60
- Oversold Level: 40
- Tips: This will give you quick intraday trading entry and exit, but you will need to confirm it with any EMI.
Best RSI settings for 15-minute chart
- RSI Period: 10
- Overbought Level: 60
- Oversold Level: 40
- Tips: A standard setting that balances speed and reliability. It works well for capturing small- to mid-term trends during intraday trading.
Best RSI settings for scalping
- RSI Period: 5
- Overbought Level: 80
- Oversold Level: 20
- Tips: Scalping trading requires very fast decision-making. It helps you decide when to enter and when to exit. However, the setup I described is considered the best for scalping. I have tried it many times, and its results have been above 60%, so I consider it good.
Best RSI settings for swing trading
- RSI Period: 14
- Overbought Level: 60
- Oversold Level: 40
- Tips: Swing traders can utilize these settings to identify opportunities while minimizing small market noise. If you follow it correctly, you’re Mastering RSI Indicator in Stock Market Best Settings and Strategies 2025
| Trading Style / Timeframe | RSI Period | Overbought Level | Oversold Level | Tips |
|---|---|---|---|---|
| Scalping (1–5 min) | 5 | 80 | 20 | Fast signals, suitable for quick trades; confirm with price action. |
| Intraday (5 min) | 10 | 60 | 40 | Reacts quickly to momentum, good for short intraday trades. |
| Intraday (15 min) | 10 | 60 | 40 | Standard setting balances speed and reliability. |
| Swing Trading (1H–4H) | 14 | 60 | 40 | Works well for capturing short- to mid-term trends. |
| Positional / Long-Term (Daily) | 14–21 | 70 | 30 | Filters out noise, ideal for trend-following strategies. |
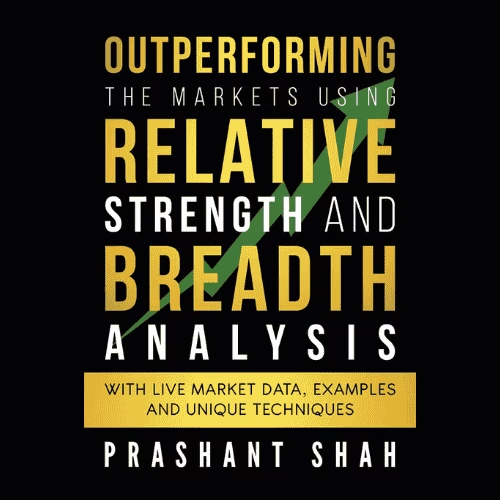
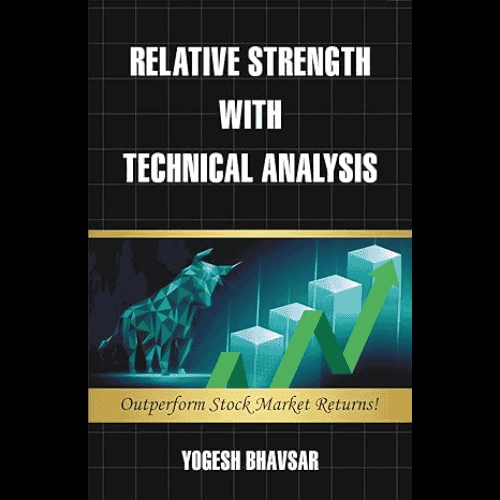
Best 3 RSI Indicator Book
I’ve already covered everything about the RSI indicator in this article. If you want to focus on other aspects or read more, I’ve recommended some books that will give you a Mastering RSI Indicator in Stock Market Best Settings and Strategies 2025
RSI full form
- RSI – Relative Strength Index
Disclaimer :
The opinions and tips shared on Namosbull.com are for educational purposes only and reflect the views of individual experts. Trading and investing in financial markets involve risk. Please consult a certified financial advisor before making any investment decisions. So, This is My Mastering RSI Indicator in Stock Market Best Settings and Strategies 2025 Article.
Q&A – RSI Indicator
If you have any questions regarding this article, Mastering RSI Indicator in Stock Market Best Settings and Strategies 2025, please let us know by commenting.


